TURNOUT
2020 turnout has already surpassed all elections since 1908, and votes are still being counted. The Washington Post projects 66.5% of eligible voters participated in the 2020 election. The last time turnout reached that level was in 1900, “when 73.7% of eligible Americans cast ballots”—and back then, the pool of eligible voters was significantly smaller than it is now, as women and many minority groups were not allowed to vote. 42 states + D.C. broke their 40-year turnout records. The last time turnout was anywhere near this 2020 election, it was 1960, when 63.8% of eligible voters cast ballots.
BIDEN MARGIN
Currently, Joe Biden leads Donald Trump 51% – 47%. It will be awhile before all of the votes cast in state like California and Washington are counted, so Biden’s lead is expected to grow to about 5% nationwide.
It’s important to note that it is rare for an incumbent to lose reelection. In the past 100 years, only four other incumbents have lost reelection: Herbert Hoover in 1932, Gerald Ford in 1976, Jimmy Carter in 1980, and George H.W. Bush in 1992. Biden received a higher share of the vote than any challenger to an incumbent president since 1932, though it should be noted that in the ’80 and ’92 races, third party challengers received a significant share of the vote, so Reagan and Clinton beat the incumbents by wider margins than that by which Biden beat Trump.
Biden is projected to win the Electoral College 306-232, the same margin Trump won in 2016. In spite of his projected five-point margin, Biden’s win in the Electoral College is comparable with the victors in tight races from the last 80 years, including Truman in 1948, Kennedy in 1960 win, and Nixon in 1968. Biden is likely to receive both a higher share of the vote and a higher margin than Obama’s 2012 victory, but he will get 26 fewer electoral votes. Looking back at 1992, Bill Clinton beat George H.W. Bush by a six point margin and received 370 electoral votes.
DEMOCRATIC HOUSE AND SENATE RACES
Democrats had a disappointing showing relative to expectations going into the November general election. FiveThirtyEight projected that Democrats had a 75% chance of winning 50 seats or more, and a roughly 50% chance of winning 52 or more seats, but losses in Iowa, Maine, and North Carolina—not to mention red states where Democrats felt they had a real opportunity, like South Carolina and Montana—have left Democrats relying on a double-win in January’s runoffs in Georgia.
In the House, FiveThirtyEight projected Democrats would hold roughly 239 seats come January, and in 80% of scenarios, Democrats would hold between 225 and 254 seats. Now, Democrats hold just 218 seats with just fourteen races uncalled. Numerous House freshmen lost their seats, and DCCC chair Cheri Bustos (who narrowly won reelection herself) resigned from her post.
Much of this has to do with a sharp decline in ticket-splitting among voters. A Pew Research survey from Oct. 21 showed that just 4% of voters planned to support a Senate candidate from the opposite party as their presidential choice. Only one state, Maine, split their vote for Senate and the presidency. Susan Collins ran seven points ahead of Donald Trump there—a healthy margin, but a huge drop from 2008, when she ran 21 points ahead of Republican presidential nominee John McCain, and 1996, when she ran 19 points ahead of Bob Dole. Depending on what happens in the Georgia runoffs, there could be as few as six senators representing states that voted for a presidential candidate from the opposite party in 2020.
While we don’t have final results yet, it seems that many freshmen Democrats in the House who won Trump districts in the 2018 wave—which saw record Democratic turnout—were brought down by an electorate whose composition more closely resembled 2016. In this way, 2020 is not unsimilar to 2016, when Democrats picked up a handful of seats in the House—after losing thirteen seats in the 2014 Republican wave—in spite of losing the presidency. Again, this can be chalked up to a lack of ticket-splitting. For example, while Oklahoma’s 5th Congressional District moved sharply to the left from 2016 to 2020 (going from Trump 53%-40% in ’16 to Trump 52%-46% this year), first-term Democrat Kendra Horn was only able to outperform Biden’s margin by two points, losing 52%-48%. Democrat Joe Cunningham won South Carolina’s 1st Congressional District in 2018, but lost it narrowly this year, 50.6%-49.3%. Like OK-5, it shifted left (from Trump 54%-40% in 2016 to Trump 52%-46%), but not by enough for Cunningham to hold on.
TEXAS, NORTH CAROLINA, AND FLORIDA
If you told Texas political observers in 2016 that four years from then, the Democratic nominee for President would win urban and suburban counties like Tarrant, Hays and Williamson, while nearly winning the Republican strongholds of Collin and Denton, and that turnout would be up by 30% in Travis County (Austin), 28% in Bexar County (San Antonio), 25% in Harris County (Houston), 21% in Dallas County, and 26% in the Rio Grande Valley—a heavily Latino area where Hillary Clinton had won 70% of the vote in 2016—they would assume that the Democrats must have gotten within a point or two of winning, if they hadn’t won the state outright.
Unfortunately, that’s not what happened. Latinos in South and West Texas took a hard right turn, and Biden’s margin in the two-party vote in counties Clinton won outside of the largest metro areas was thirteen points below hers (57% vs. 70%). If Biden had managed to hold Clinton’s margins there, it would not have been enough to ensure victory, but it would have cut Trump’s margin down from 6 points to 4.5 points.
And while the swing in suburban counties would have erased much of Clinton’s deficit with Trump, grew his vote lead in some exurban counties (Comal, Parker, Randall, Montgomery, etc.) even as his vote share decreased. Combined with Trump building on his strength in the Panhandle and East Texas, and the results were a disappointment for Texas Democrats.
A similar story emerged in Florida. Biden managed to win the critical swing county of Pinellas, became the first Democrat since Jimmy Carter to win Duval County (home to Jacksonville), and improved among seniors (narrowing Trump’s lead in Sumter County, home to the Villages). However, propelled by Cuban and Venezuelan voters, Trump dramatically narrowed his deficit in Miami-Dade County, from 29 points in 2016 to just 7 points in 2020.
In North Carolina, Democrats continued to make big gains in Asheville, in the Charlotte area, and in the Research Triangle, with Biden improving on Clinton’s margin by four points or more in each of these areas. However, the rest of the Appalachian region of North Carolina continued to slide towards Republicans, and Trump managed to gain a couple points in the Black Belt region.
ARIZONA AND GEORGIA
Biden was able to pull of wins in Arizona and Georgia, states which have not gone to Democrats at the presidential level since 1996 and 1992, respectively.
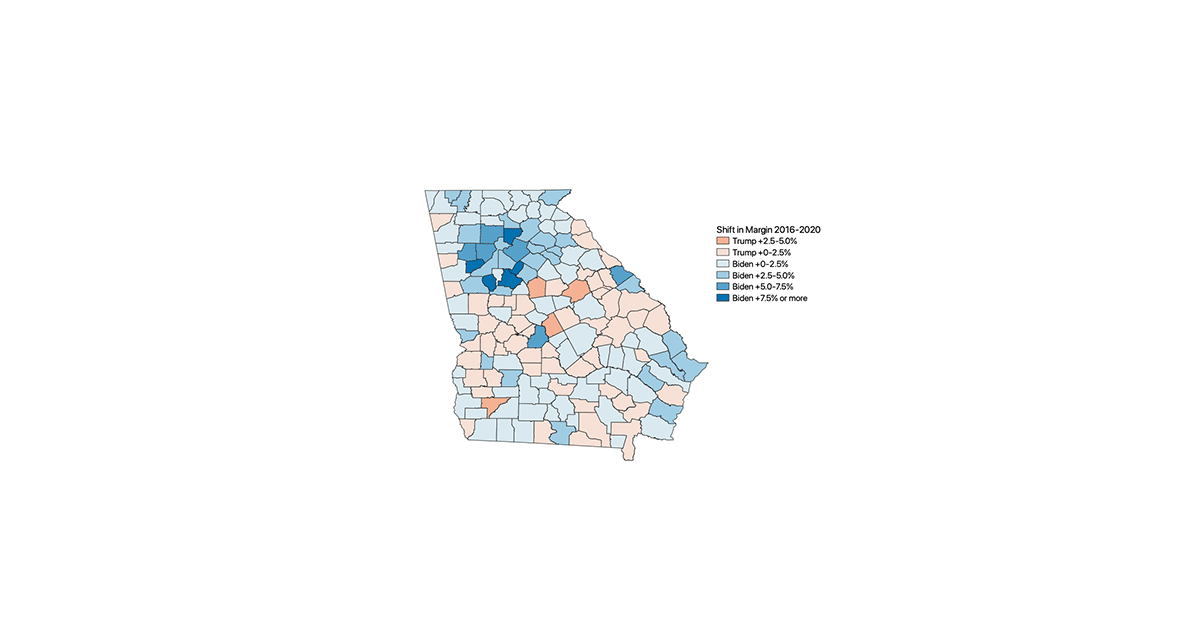
In Georgia, a great deal of attention has been paid to the efforts of Stacey Abrams and others to register and turn out new voters—800,000, according to the New York Times. Those new voters were needed to overcome a less talked about but perhaps larger surge in registration and turnout among Republicans in Georgia. Nineteen counties in Georgia had more voters show up to the polls this year than were registered in 2016, and Trump won these counties by a whopping 71%-28%. Overall, Trump increased his vote total in Georgia by 18%, adding nearly 369,000 new votes to his 2016 total.
But this pales in comparison to Biden’s gain of 594,000 votes over Clinton’s 2016 total, a 32% increase. From the map below, you can see Biden made huge gains in suburban and exurban counties surrounding the city of Atlanta. 70% of Biden’s vote increase over Clinton came from just 13 of Georgia’s 159 counties; 47% came from just four counties. That is not just a product of the size of the counties in question—the four largest counties in the state only accounted for 16% of Trump’s increased vote share, and the thirteen counties that gave Biden 70% of his growth over Clinton gave Trump about a third of his additional votes.
In Arizona, Biden eked out a 0.3% win, also on the back of strong minority turnout and a suburban swing to Democrats. Trump actually improved on his vote share (47.6%->49.1%) and his raw vote total increased by 32% from 2016. But Biden did even better, increasing Clinton’s raw vote total by over 500,000 voters—a 44% increase. This is thanks in large part to Maricopa County—Biden became the first Democrat since Harry Trump to win the county, and the first since LBJ to even break 45% of the vote there.
Pima County (home to Tucson) also played an outsized role in Biden’s win. While the county has supported Democrats at the presidential level since 1992, but Biden’s 59% of the vote here is the best performance by a Democrat since 1940, and Biden netted 97,223 votes over Trump here. Statewide, Biden won by fewer than 11,000 votes.
Trump did improve slightly in Santa Cruz and Yuma counties, the two majority-Latino counties in Arizona. Trump’s share of the two-party vote rose from 50.6% to 53.1% in Yuma and from 25% to 32% in Santa Cruz. This suggests Latinos in Arizona did shift to Trump, even if not in the same numbers as Latinos in Texas; the shift of Latinos to Trump in Texas also had a larger effect because, according to data from L2, Latinos only make up about a third of registered Democrats in Arizona, while they make up half of likely Democrats in Texas.
2020 EARLY/MAIL VOTING
The increase in turnout in the 2020 election can, in large part, be chalked up to changes made to make voting easier, spurred by concerns about the pandemic.
43 states and D.C. now have some form of early voting, and twenty three states expanded mail-in voting in response to the pandemic. A record 93 million votes were cast early, nearly double the 47 million cast in 2016. Mississippi, the only state which did not have some form of early or no-excuse absentee voting was also the only state whose turnout is projected (at least by some sources) to fall below its 2016 level.
POLLING IN 2020
Following perceived polling misses in the 2016 election, pollsters made a concerted effort to correct their mistakes, mostly through weighting by education. However, polls seem to have been off by just as much in 2020, even with these corrections, making the error much more concerning.
Sam Wang at Princeton writes that, “(1) In states where polls favored Biden, the actual vote margin favored Trump by a median of an additional 2.6 points. (2) In states where polls favored Trump, Trump did better by a lot – 6.4 points median, and increasing steeply with his vote share.” Things were even worse in Senate polls, where the median error was 4.5 points, “the largest such error in the last 20 years.”
Wang believes it is possible that the samples of non-college and Latino populations—both of which swung towards Trump—were too small and thus missed some nuance. After all, these are two of the hardest subgroups to survey.
Dr. Val Smith, Wayne Johnson, and Bereket Kelile at SJR Opinion Research argue the polls suffered from “confirmation bias”—that they ignored or dismissed results that went against their prior beliefs. They point to the criticism received by the Trafalgar Group, a polling firm who had accurately predicted Donald Trump’s wins in Michigan and Pennsylvania in 2016, and who were among the few pollsters showing Trump close or ahead in states like Wisconsin and Pennsylvania, which ended up being much closer than polling averages suggested.
However, much of the criticism of Trafalgar seems merited, stemming from the firm’s refusal to release their methodology, and Trafalgar does not seem to have fared much better than other pollsters this cycle, after predicting Trump wins in Georgia, Nevada, Pennsylvania, Arizona, and Michigan. Surveys from reputable pollsters that looked like outliers (notably the Selzer & Co. poll of Iowa, which accurately predicted Trump’s significant margin there) were taken seriously, suggesting confirmation bias was not the issue.
If anything, given the polling misses in 2016, pollsters were strongly incentivized to downplay Biden’s strength in swing states. Pollsters knew that if they, say, had Biden winning Wisconsin by five and he ended up winning it by eleven, that would garner less criticism than if they had Biden winning by five and he lost the state by one. Pollsters may have wanted Biden to win—I can’t speak to Nate Cohn’s or the folks at Monmouth’s personal politics, but demographics suggest most ostensibly non-partisan pollsters probably do lean left—but their professional incentives should have strongly pushed them in the opposite direction, which is why polls showing Biden with huge leads in Wisconsin and Pennsylvania were so believable, and why the misses are so problematic.
Another potential problem could have been “herding,” a practice in which “some political pollsters adjust their findings to match or closely approximate the results of other polls.” Because pollsters are so strongly incentivized to get the results right, they may be disinclined to release results that differ dramatically from what other pollsters are releasing. There is strong evidence that herding caused pollsters to miss the surge in support for the Coalition in Australia’s 2019 general election, and some have suggested herding was the culprit behind the polling misses in 2016. However, little evidence has emerged that herding was the culprit in this year’s errors, and it is the near-universality of those errors—that everyone, including Republicans’ own internal pollsters, missed the GOP’s strength heading into the general election, not just public pollsters—that makes the problem so alarming.
David Shor, well-known Democratic data guru, believes the issue is caused by partisan non-response bias—basically, that Democrats were likelier to answer polls, and therefore were overrepresented in their results. He chalks this up to 1) higher levels of engagement among Democrats during the pandemic (he says, for example, the number of respondents in his survey who were ActBlue donors “skyrocketed” from March onward) and 2) that voters are splitting along levels of social trust, with voters with high levels of social trust skewing towards Democrats while those with low levels of social trust are flocking to Trump. People with high levels of social trust are likelier to answer surveys, and that’s always been the case; but before 2016, there was little partisan difference between those with high levels and low levels of social trust. That changed in the Trump era, which skews polls towards Democrats.
The pandemic’s impact may also be key here. On the NYT’s The Daily podcast, their polling expert, Nate Cohn, points out that the largest swing state polling misses came from states with higher infection rates, and that Biden’s numbers shot up with the number of COVID cases. Pollsters believed at the time that this spike for Biden was part of a backlash against Trump. Instead, it may just be that, if Democrats were taking the virus more seriously, they were likelier to be at home and therefore likelier to take a survey, biasing the sample.
Some questions remain. Why, for instance, were the polls close to the final result in Minnesota (final polls showed Biden winning by nine points there in the FiveThirtyEight average, and he won by 7.2%) but wrong by a significant margin in neighboring Wisconsin (off by eight points)? And what difference in methodology lead some highly-rated pollsters (Siena College/NYT, Monmouth, Emerson) to show Biden with a lead in Iowa, while others (namely, Selzer & Co.) nailed the final result (Trump +8)?
It is obvious that weighting by education did not do enough to correct the issues we first discovered in 2016. Weighting by geography could help, but if this issue is ultimately one of psychological differences rather than demographic, pollsters will struggle to find any solution.
